Introduction
Unlike most pages on my site this is more of an opinion piece. It addresses Flex's debugger and profiler, and it makes a case for why you should learn and use them. If you're already using them you can move on (though you might find the references at the end of this post useful). |
The Debugger is in both versions of Flash Builder; the Profiler is available only in the Premium version. |
Why use the debugger and profiler?
It always baffles me when I hear someone say they debug their programs using just trace statements and they've never bothered to learn their IDE's interactive debugger. What's really baffling is that more than once I've heard this from some very good programmers. I once worked with a SAS app developer who was very knowledgeable, way above average, yet when it came to debugging he only used the equivalent of trace statements. When I asked why he never used the SAS/AF debugger (a very nice command line debugger) he had no good answer — he just hadn't bothered to learn it, hadn't had the time, and besides, it looked too complicated, using trace statements was good enough.Yeeesh. The "effort" of learning a debugger pays for itself almost immediately. Even a simple debugger that supports breakpoints and variable inspection makes finding and resolving problems much, much easier than using trace diagnostics. Luckily, the debugger usually isn't a hard sell — once you walk someone through the features of a debugger they generally become a convert.
The profiler can be a harder sell. After all, if a program runs without errors and the client is happy, well, why bother? Yet using basic profiler features often makes glaringly evident problems that can bite you later (e.g., memory leaks that may cause problems only after extended execution, as in a kiosk application).
That last point about using "basic features" is worth stressing — you don't need to know every feature of the debugger and/or profiler, just learning the basics can be enough — I'm no expert in either, especially performance profiling, but several times my limited knowledge has yielded signficant benefits.
Memory profiling use cases
To make my case for the profiler's utility I'll provide a few examples. These are real-life examples from memory profiling I performed on my World Data Explorer demo app. Here are 3 ways in which using the profiler to examine your app's memory usage can be helpful...Useful for highlighting the shortcuts you took early in development.
This is a simple example driven by something that most of us have done at one time or another — taking a programming shortcut when in a hurry, intending to come back later and clean up that code, but then never getting around to reworking that code.When I first created the World Data Explorer demo app I took a shortcut in how I used sound files. In this app I allow the user to select one of 4 sounds as the global alarm sound. At the time I just embedded the four mp3's into the SWF. Why? Mostly I was in a hurry, and this approach was "good enough for now". Since I knew I wanted to embed the default sound (for performance reasons) I just replicated the embed code for the other three sounds, making a mental note that I really should be pulling the sounds dynamically as needed. The cost, of course, was a slightly bloated SWF. And, since I subsequently assigned each sound to a variable, I ended up with all four sounds in memory, thus increasing my app's memory footprint. Knew it wasn't good, but I was in a hurry, took a shortcut.
Here's where the profiler comes in. When I installed FB4 I fired up the profiler on my app and immediately my shortcut was evident. You couldn't miss it — in the Profiler's "Live Objects" pane, which by default is sorted by memory usage, my four sound instances were near the top of the list. At startup they collectively use nearly 20% of memory; as my app ran they remained near the top of the list.
So, here's a case where the profiler provided a reminder of my shortcut, and its highlighting of memory usage motivated me to address the issue — it took maybe 10 minutes to rewrite my code to use a single Sound instance instead of four instances, dynamically pulling the "active" alarm sound thru a URLRequest call and assigning it to my (lone) Sound instance.
Useful for finding problems you were aware of, thought you'd addressed, but in fact had overlooked in a few places.
The Data Explorer demo app lets the user choose between 3 viewersManagers (one manages dataViewers via nested Divs, another uses floating/resizable/closable windows, the third uses a simple TabNavigator). When the user changes the active viewersManager I set up the previous manager for garbage collection by nulling references and whacking any event listeners.Well, I did this most places. However, running the app through the profiler and watching object memory usage as I changed viewersManagers I could easily see that one manager wasn't getting garbage collected. Why? Because I'm a bonehead and I'd overlooked one reference, hadn't nulled it. It took just a few seconds to address the problem. So, here's a case where I knew there was a potential for problems, and mostly I'd taken the appropriate actions to set up my viewersManager instance for GC, but (fallible me) I'd missed one reference.
Of course, all you infallible programmers out there don't have to worry about things like this, but the rest of us can benefit from the profiler's ability to highlight things we just plain missed — e.g., instances that aren't being garbage collected as we'd expected.
Useful for finding problems that you hadn't been aware of.
Here's another World Data Explorer example, this one related to a component I didn't create, the Yahoo developer AS3 Map component.The Data Explorer demo app uses the Yahoo map component in one of its dataViewers. Now, I want to be clear here, I appreciate the Yahoo folks work, and I like the component a lot. However, I got a bit of a shock the first time I watched it instantiate and begin pulling down map data during a profiler session.
A screencap of the memory profile panel (fig 1 below) shows what I'm talking about. Here's a summary of what's happening...
- 1. At startup (Time=3 seconds) the memory usage bumps up slightly and then levels off as the Welcome screen loads and then waits for user input; some data is loading in background.
- 2. At 10 seconds the user clicks past the Welcome screen and the app state shifts into data display mode. The MainDataDisplay class is created, then the default viewersManager is created, then finally the default dataViewers are created.
- 3. At 20 seconds the graph goes ballistic, memory usage more than doubling. In the profiler I can see that this is where the Yahoo map viewer is instantiated and gets to work retrieving map segments. Note that other test runs show that this spike in memory usage occurs only when the map viewer is created.
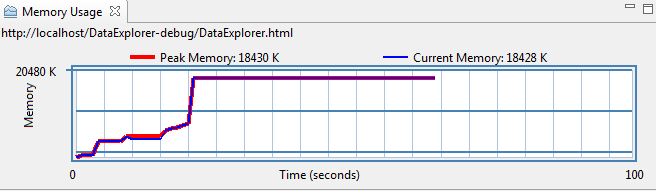
Fig 1: Memory Usage of World Data Explorer demo app at startup
Of course, this memory usage may not be unexpected behavior since the map component is pulling down chunks of the map which it then tiles, also pulling down off-screen bits for buffering in case the user scrolls the map. Obviously all those bitmaps can add up to a good chunk of memory. Still, this memory consumption deserves some follow-up — maybe look for a newer, more efficient version of the class (not available in this case), maybe look for a parm that reduces the number of map parts being buffered, or maybe even try out Google's AS3 map class and compare its memory usage to that of the Yahoo component. The point here is that, once again, a profiler session made it easy to see a potential problem which should be investigated.
References — Flex profiler (and some for the debugger)
Ok, I'm suggesting that you take the time to learn these topics, so let me make it a bit easier for you by providing some online resources I found especially useful. I particularly recommend the videos, all of which have walk-throughs of debugging/profiling sessions.Obviously you should refer to FB4 doc:
- Here's a starting point for the debugger and here's one for the profiler. If you like having the content in book form you can download the "Using Flex Builder 4" PDF here.
- Max 2008 presentation on the debugger and the profiler
- 360 Flex presentation on the profiler
- Flash Builder's Lost Features Episode 2: Profiler:
- Flash Builder 4 Profiler, ExternalInterface Memory leak
- Alex Harui, always a great source of information on Flex, has an interesting interactive post on the profiler

About
JavaScript
JavaScript appdev primers
General JavaScript
SPA Demo Application
Backbone Demo Application
Recommended sites
- Addy Osmani's blog
- Derick Bailey's Backbone posts
- Murphey's JQuery Fundamentals (original)
- Crockford's JS videos
- MSDN Project Silk
Flex/AIR
Flex/AIR primers
- Primer on Flex/AIR Multiscreen Development
- Primer on Mobile App Development w/Flex 4.5
- Primer on Flex 3 Component Lifecycle
- Primer on Flexlib MDI
Flex demo apps
all require Flash Player!
AIR mobile dev
- AIR mobile dev Tips
- AIR and Android Back key
- AIR, StageWebView, displaying local content
- AIR for Android memory issue w/large images